“Data visualization” is when data are presented in a visual way that allows people to quickly understand what they mean. This Slide Makeover features a slide from a presentation given to parents in the Quabbin Regional School District (QRSD) in Central Massachusetts this fall. It was supposed to move us to action but because the important data was hidden by visual clutter, it didn’t cause any audience reaction because we couldn’t tell what was going on.
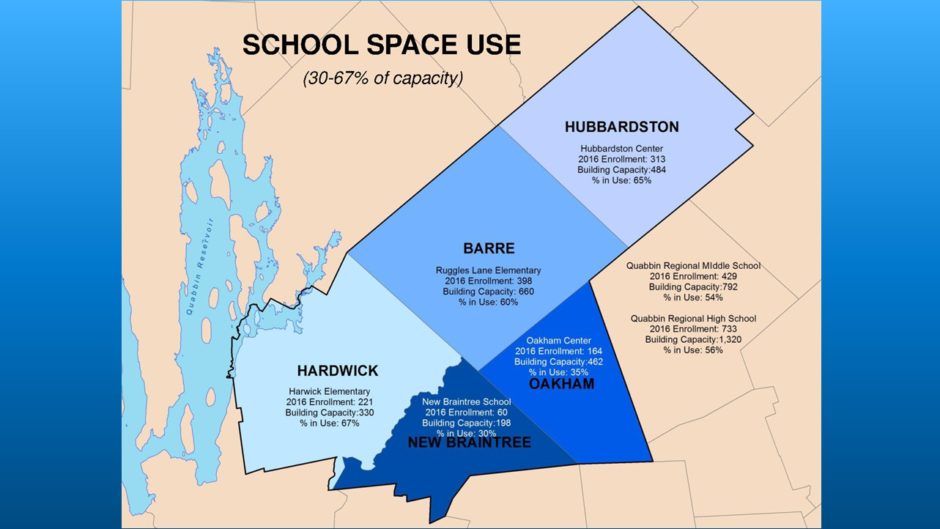
Before
Problem 1
The way the text is worded obscures the problem. Presently, the focus is on how much space is used in each school. But the shocking information is how much space is not used.
Problem 2
The important information is too small. I was in the audience and all I could read were the title, subtitle and town names.
Problem 3
The data for each town’s school appears on the map within the town borders. Because of the way the towns are located geographically, this prevents people from quickly scanning and comparing the data.
Problem 4
The map is the main focus but the data should be. The map isn’t even needed because the audience was from the school district and were all familiar with its layout.
After
Solution 1
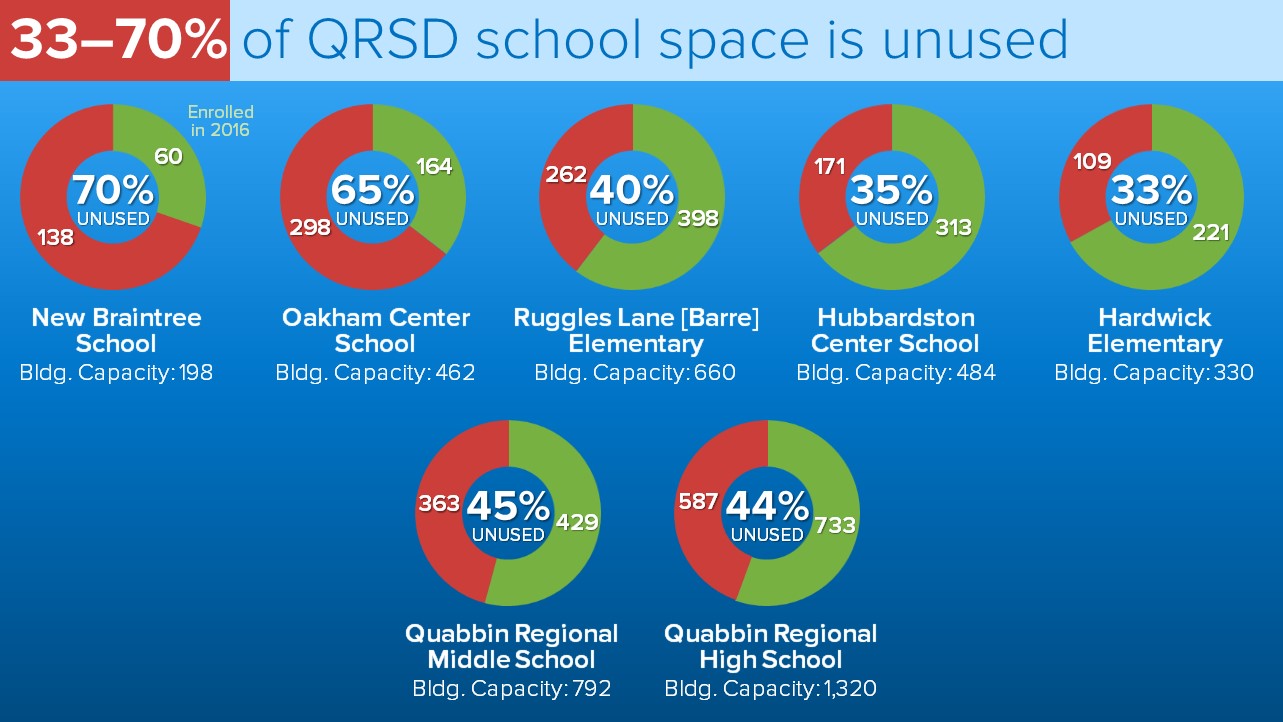
Check out that arresting headline! I changed it from “School Space Use: 30–67% of capacity,” which is a very passive way of expressing it to “33–70% of QRSD school space is unused.” This is an important distinction, because the problem isn’t the number of students each school supports but rather how many vacancies there are in 2016.
Originally, the focus was on the percentage of available space in each school that is currently being used. By changing the last line in each text block to “percentage unused” and recalculating the numbers, the focus shifts to the vacancy rate. For the title, I made the same change plus I added a red box behind the new percentages to emphasize them. Red = bad and this news is certainly bad for the QRSD!
Solution 2
The type is bigger and there’s less of it.
Solution 3
I’ve created graphs for each school, noting the number of enrolled students in green and the number of additional students needed to reach capacity in red. Getting the latter number was a simple matter of subtracting the amount of students enrolled in 2016 from the total capacity.
I arranged the charts to show the vacancy rates from highest to lowest, with the two regional school graphs on the bottom. Due to this arrangement and the bold colors, it’s easy to get an overall sense of the data.
Solution 4
I removed the map.
In conclusion…
If you want to move people to action, you have to go beyond a strict reporting of the numbers. In this case, data visualization allows people unfamiliar with the intricacies of school space usage to quickly understand the scope of the problem.
You must be logged in to post a comment.